Introduction
Overview
Data Lake is a technical term related to Big Data. A Data Lake is simply a repository that holds raw data awaiting processing, analysis, and insights.
Data Lake has the following properties:
- Collects everything – stores all types of data, whether raw or processed, over a prolonged period.
- Multi-user – allows multiple users to refine, explore, and enrich the data.
- Flexible access – supports various data access patterns on shared infrastructure: batch, interactive, real-time, search, in-memory, and other processing tools.
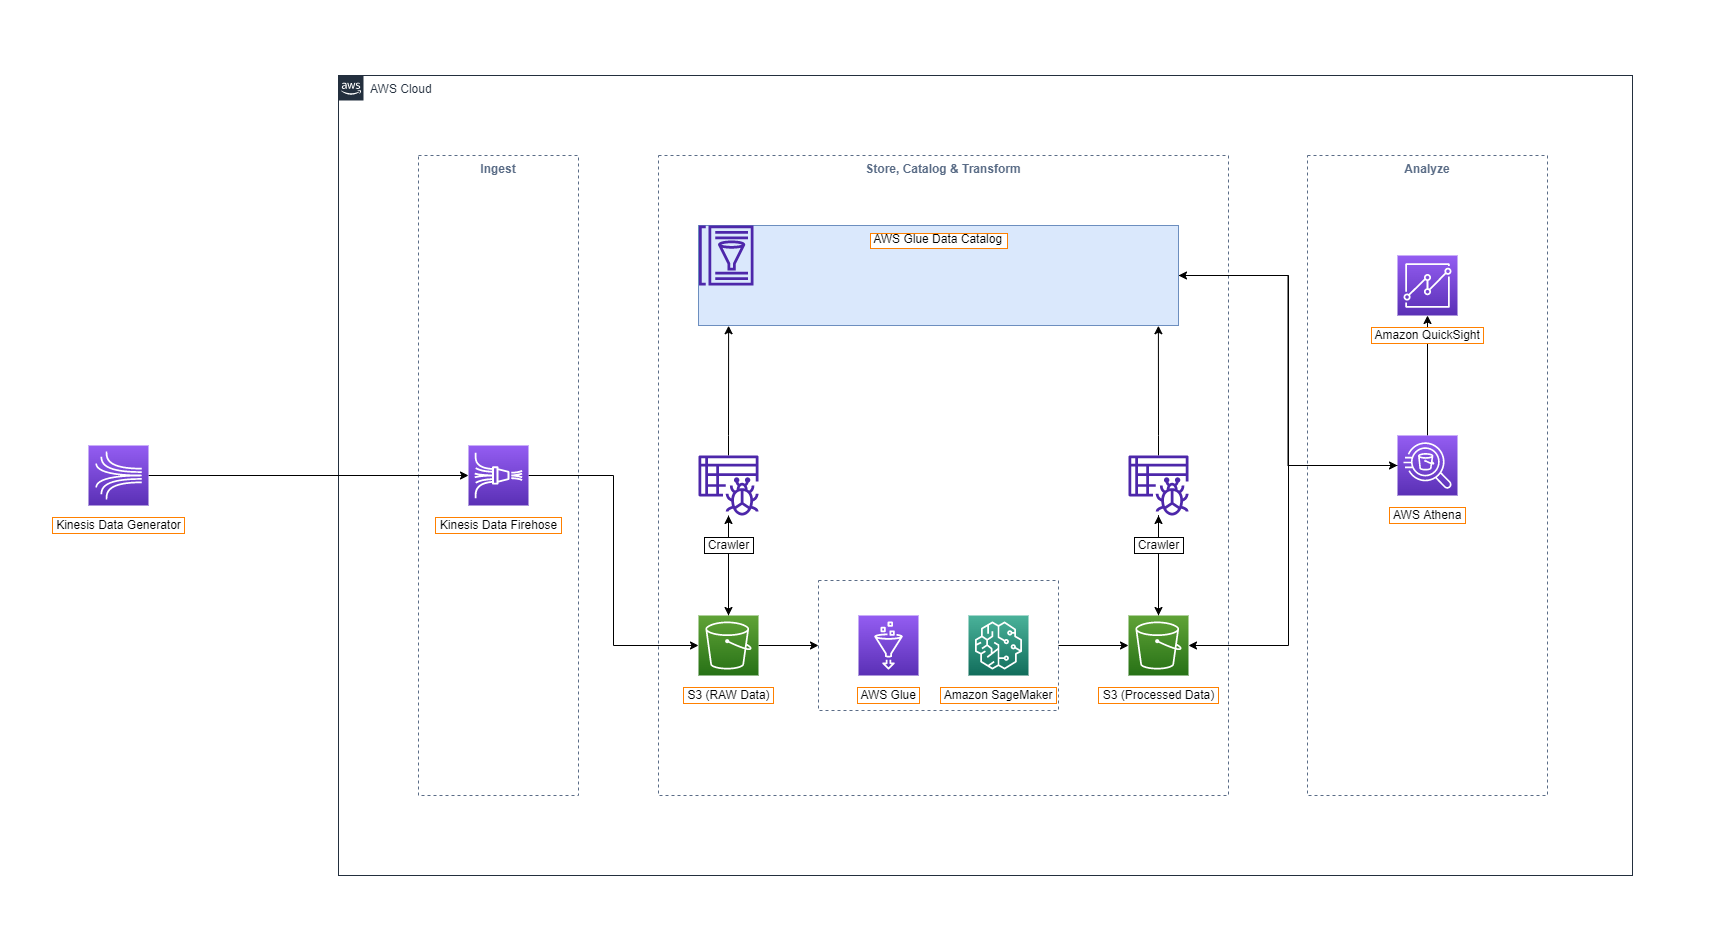
Amazon Glue is a complete ETL service. You can use Glue Crawlers to identify your data and store related metadata (e.g., table definitions and schema) in the Glue Data Catalog. Once categorized, your data becomes immediately searchable, queryable, and ready for ETL jobs.
AWS Glue ETL can generate code to perform data transformation and load the data into storage. AWS Glue is capable of creating customizable, reusable Python code.
Once your ETL Jobs are ready, we can schedule them to run on a scalable Apache Spark environment managed by AWS Glue.

Amazon Athena: an interactive query service used to analyze data in Amazon S3 using standard SQL. You simply point to your data in Amazon S3, define the schema, and start querying using the built-in query editor. Amazon Athena allows you to exploit all your data in Amazon S3 without having to set up complex ETL processes. Athena charges based on the queries that are run.
Amazon Athena uses Presto with ANSI SQL support and works with several standard data formats, including CSV, JSON, ORC, Avro, and Parquet. Athena is recommended for fast querying needs, but it can also handle complex analytics, including joins on large datasets, window functions, and arrays.

Amazon QuickSight: a fully managed data visualization service by AWS.

-
Data source is an external data repository, and you need to configure how to access data in this external repository, e.g., Amazon S3, Amazon Athena, Salesforce, etc.
-
Dataset defines the specific data within the Data source you want to use. For example, the Data source could be a table if you are connecting to a database Data source. It could be a file if you are connecting to an Amazon S3 Data source.
-
Analysis contains a collection of Visuals and stories relevant, for instance, to a specific business objective or KPI.
-
Visual is a graphical representation of your data. You can create different types of Visuals within an analysis, using different datasets and Visual types.
-
Dashboard is a page that includes one or more Analyses for viewing only, which you can share with other Amazon QuickSight users for reporting purposes. The Dashboard retains the configuration of the Analysis at the time you publish it, including things like filters, parameters, controls, and sorting order.