Visualize with QuickSight
Visualize with QuickSight
In this step, we will perform visualization using QuickSight.
-
Log in to the Amazon QuickSight Console and complete the registration process. You can refer to the registration process here.
-
Access the AWS Management Console.
- Find QuickSight
- Select QuickSight
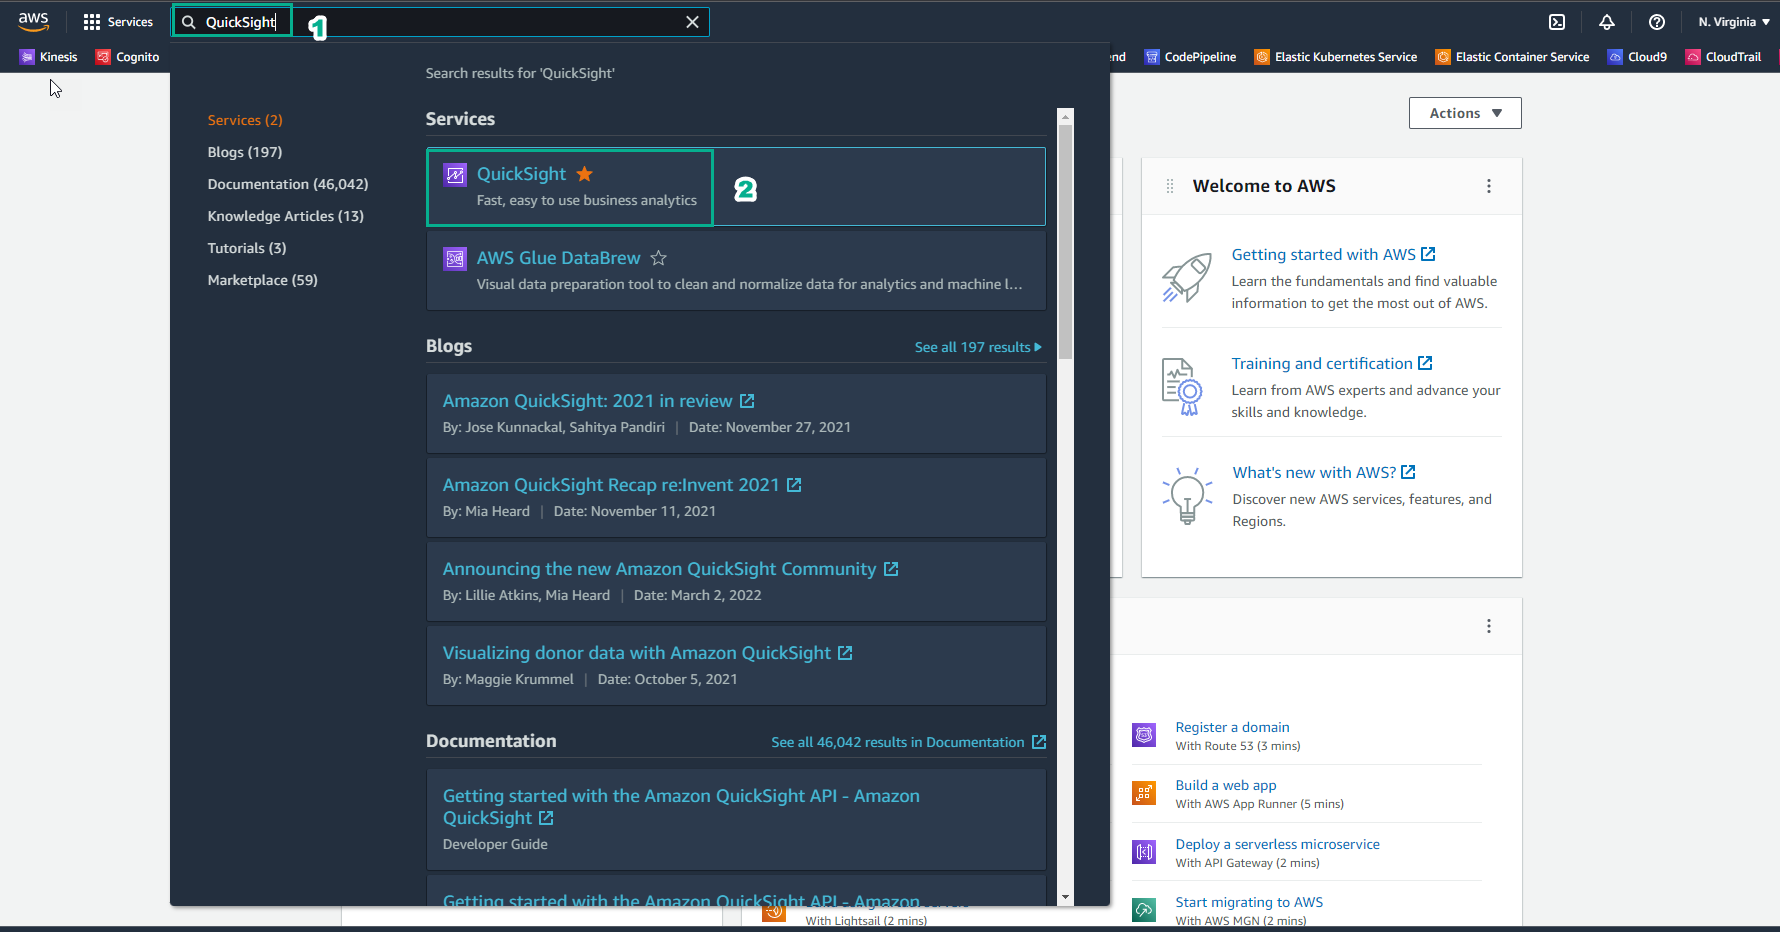
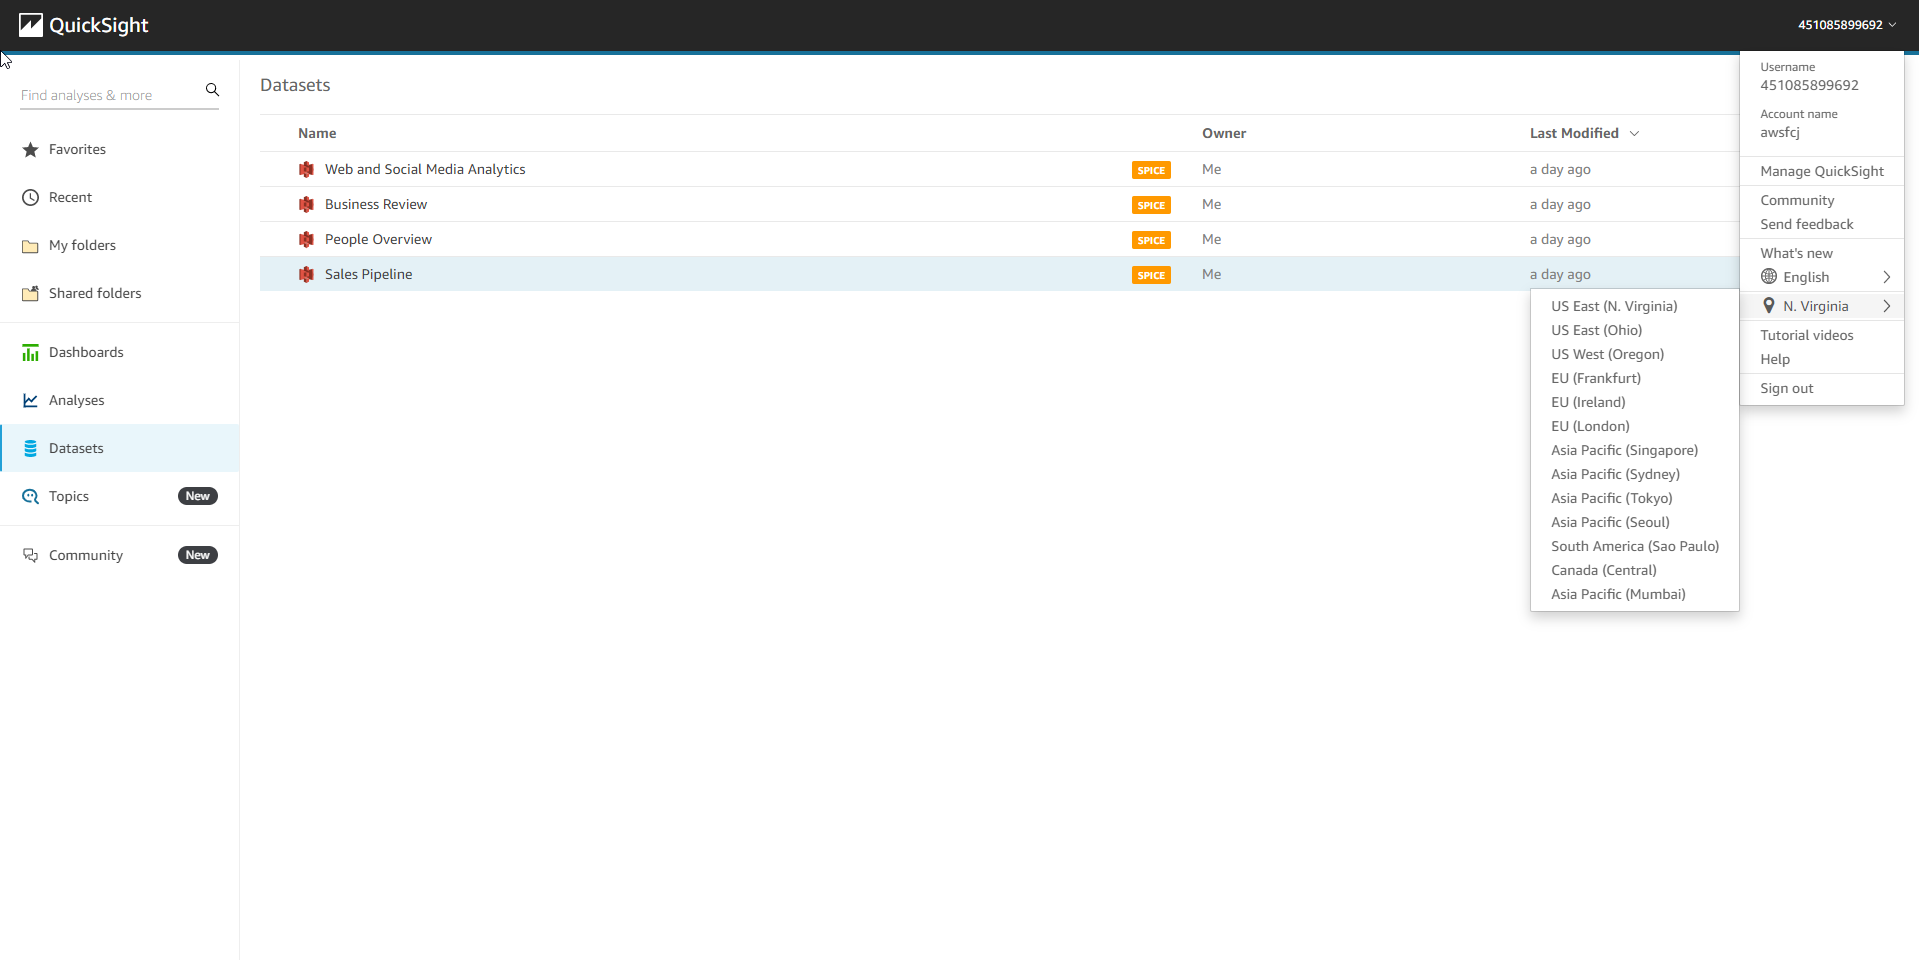
Note: Pay attention to the Region you are using. Check and switch the Region if necessary to avoid errors.
-
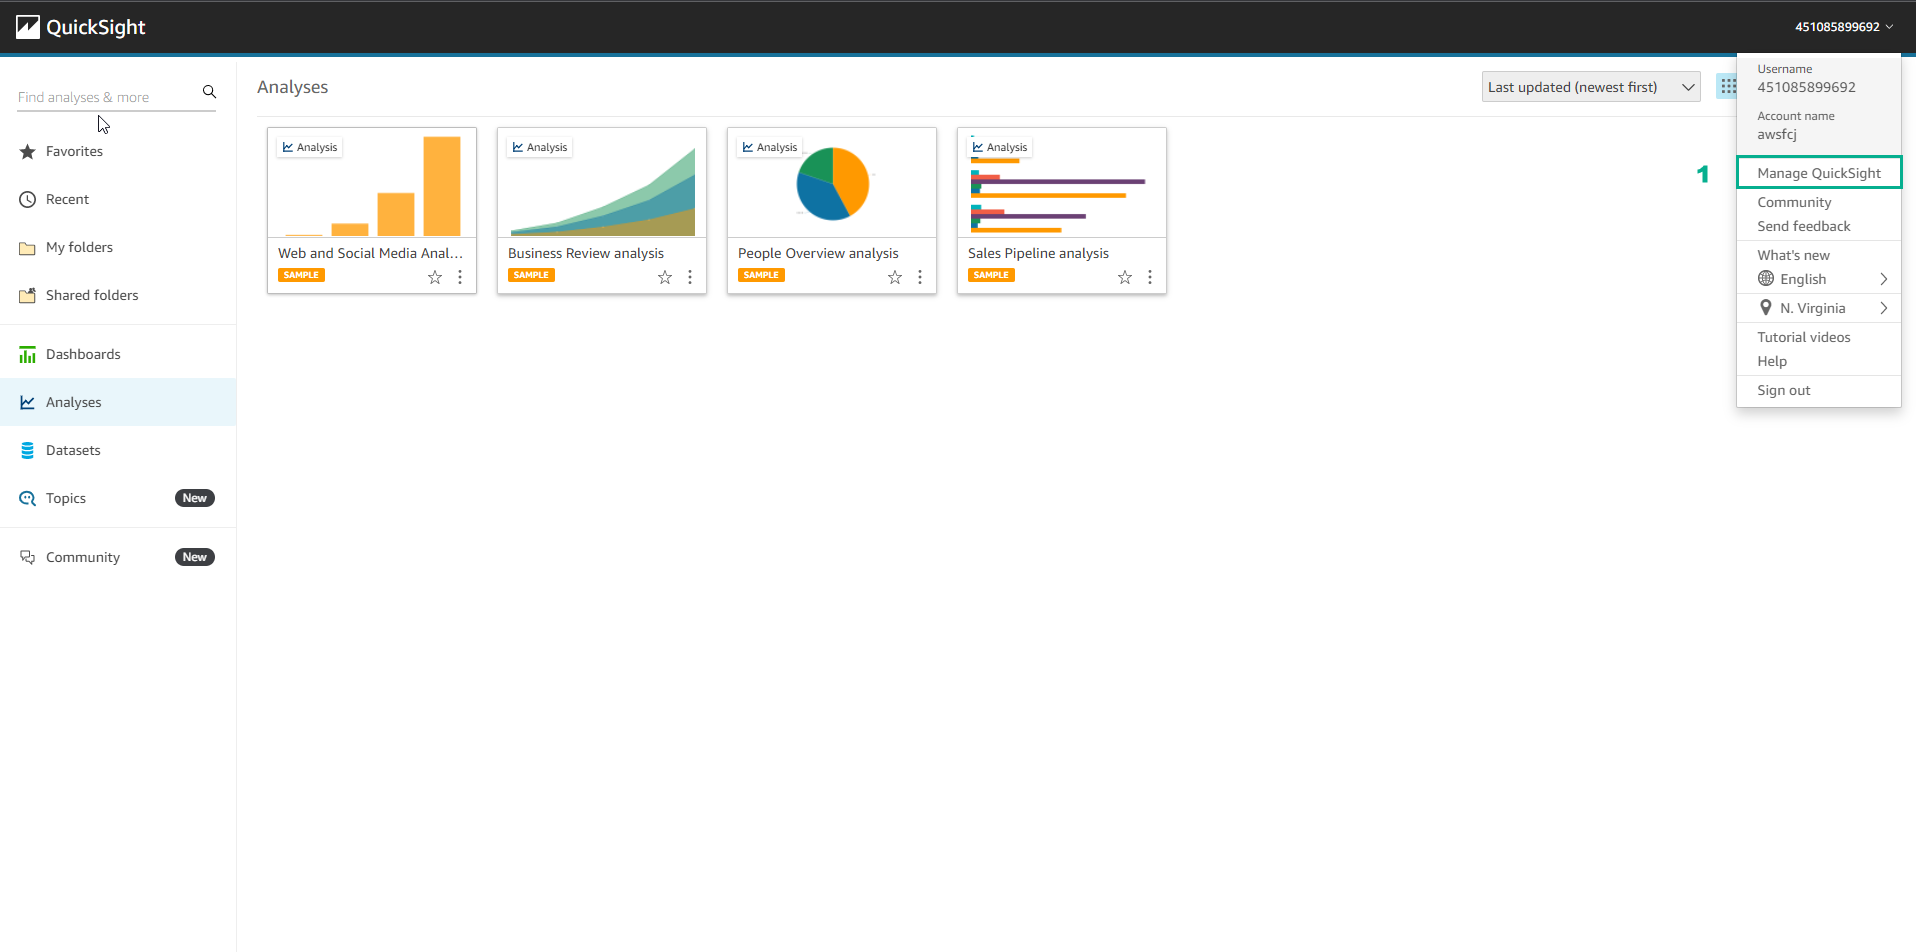
In the QuickSight interface, select Manage QuickSight
-
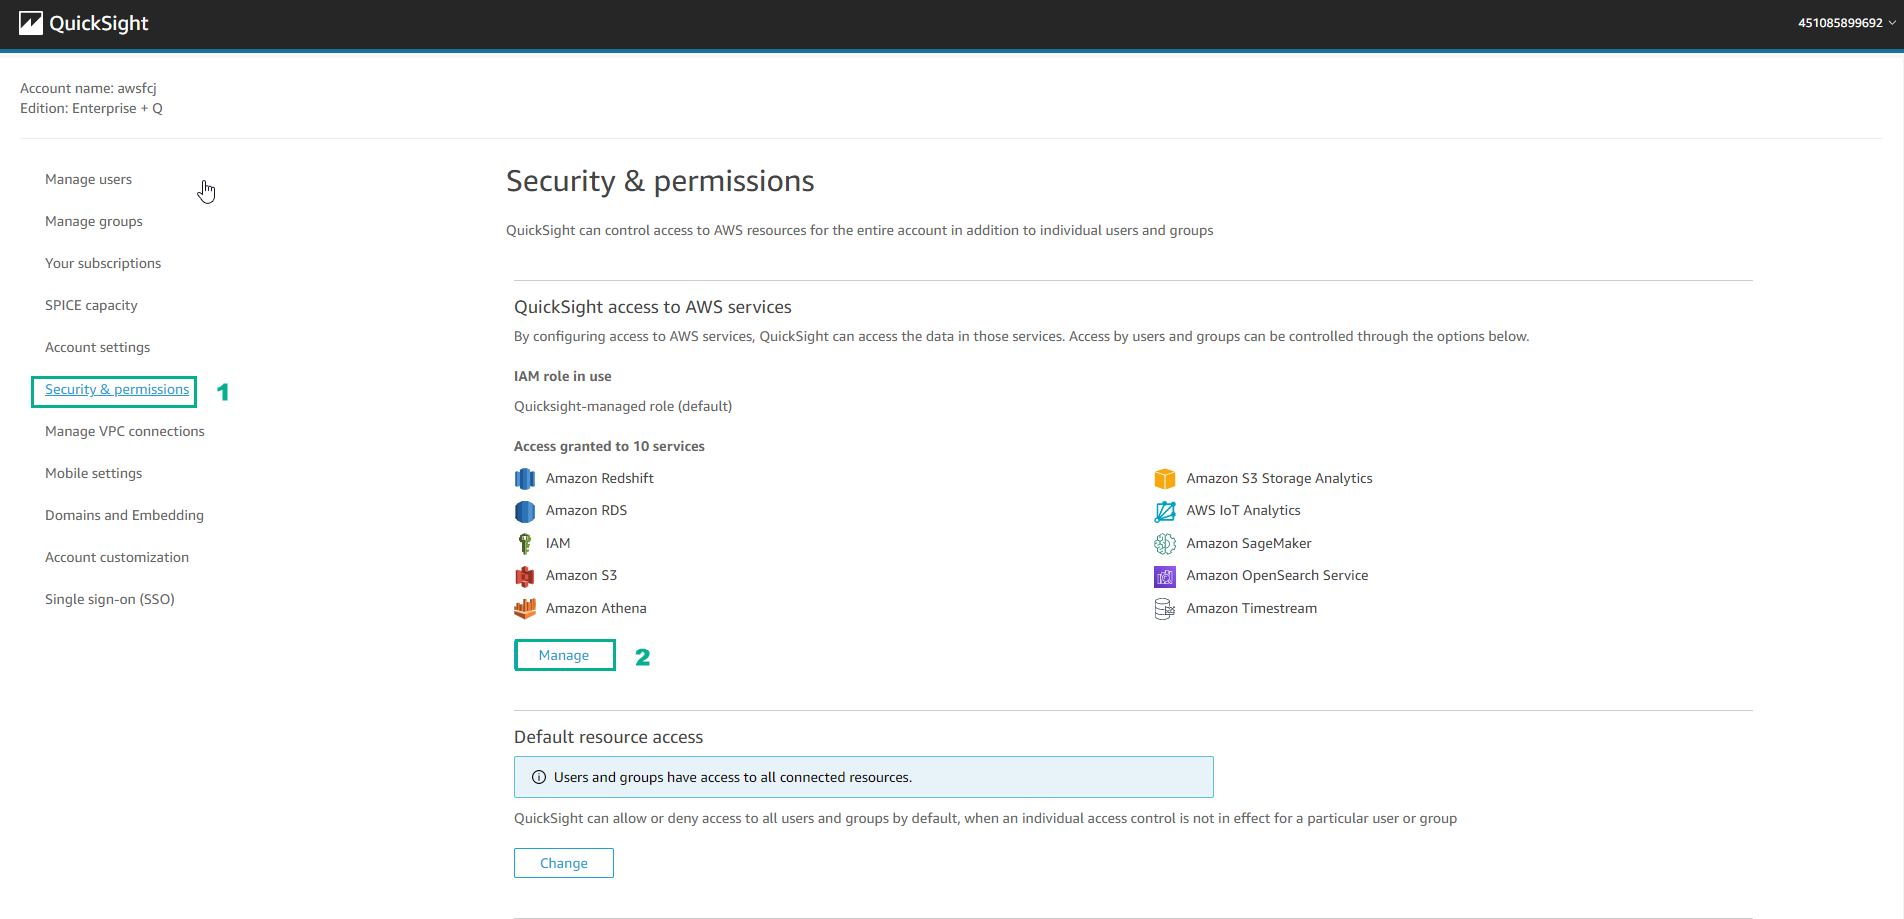
Configure Permissions
- Select Security & permissions
- Select Manage
-
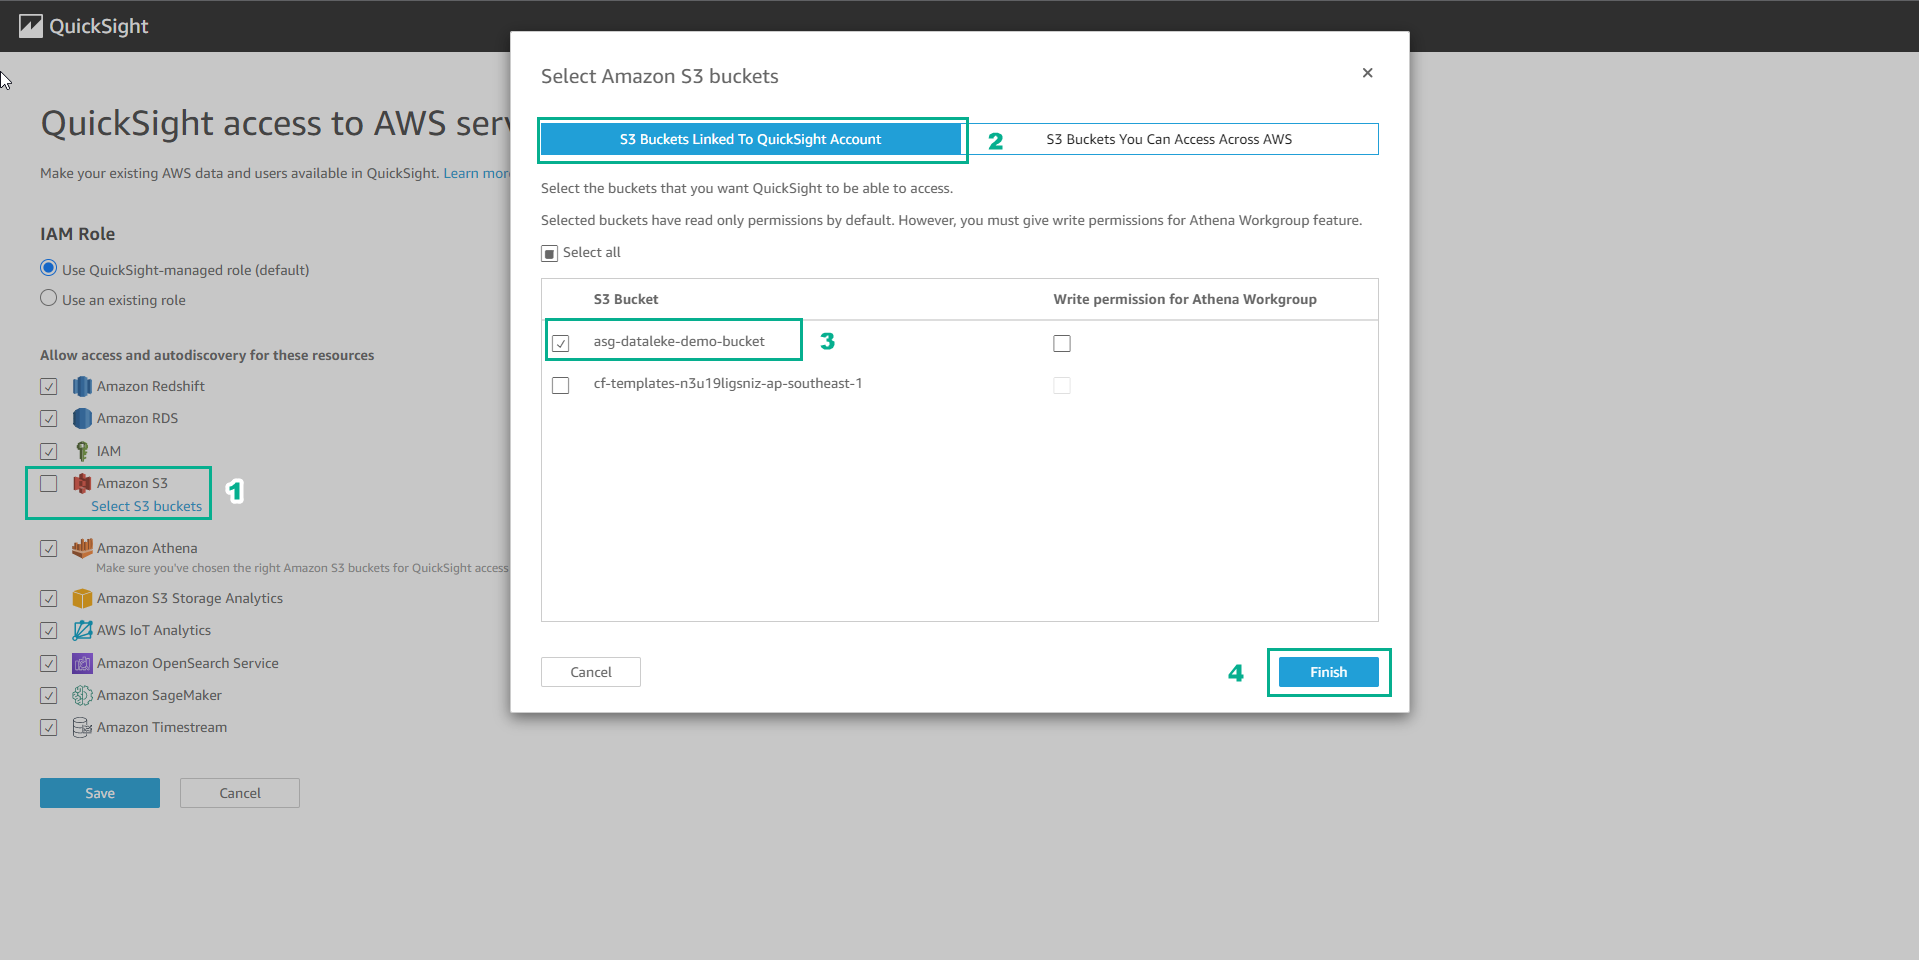
Select the services and choose Amazon S3
- Select S3 Buckets Linked To QuickSight Account
- Choose asg-datalake-demo-bucket
- Select Finish
-
Select and review the Role and services. Then, select Save

-
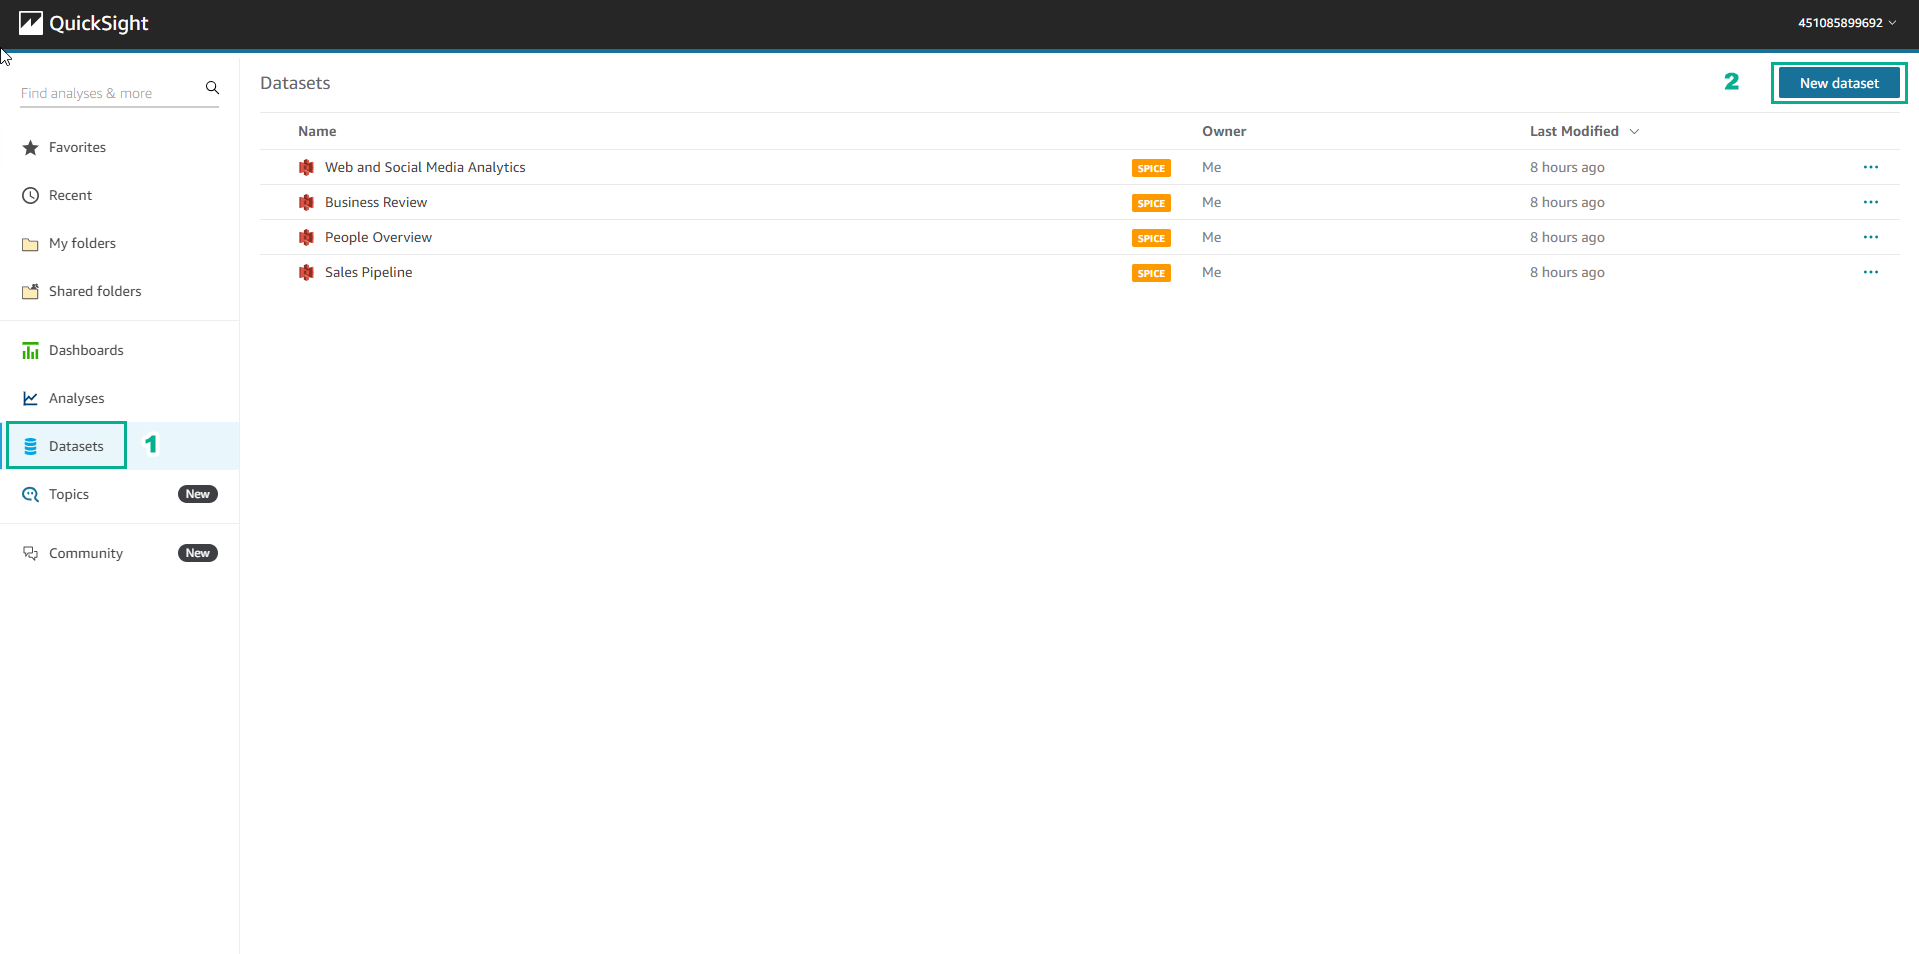
In the QuickSight interface:
- Select Datasets
- Select New dataset
-
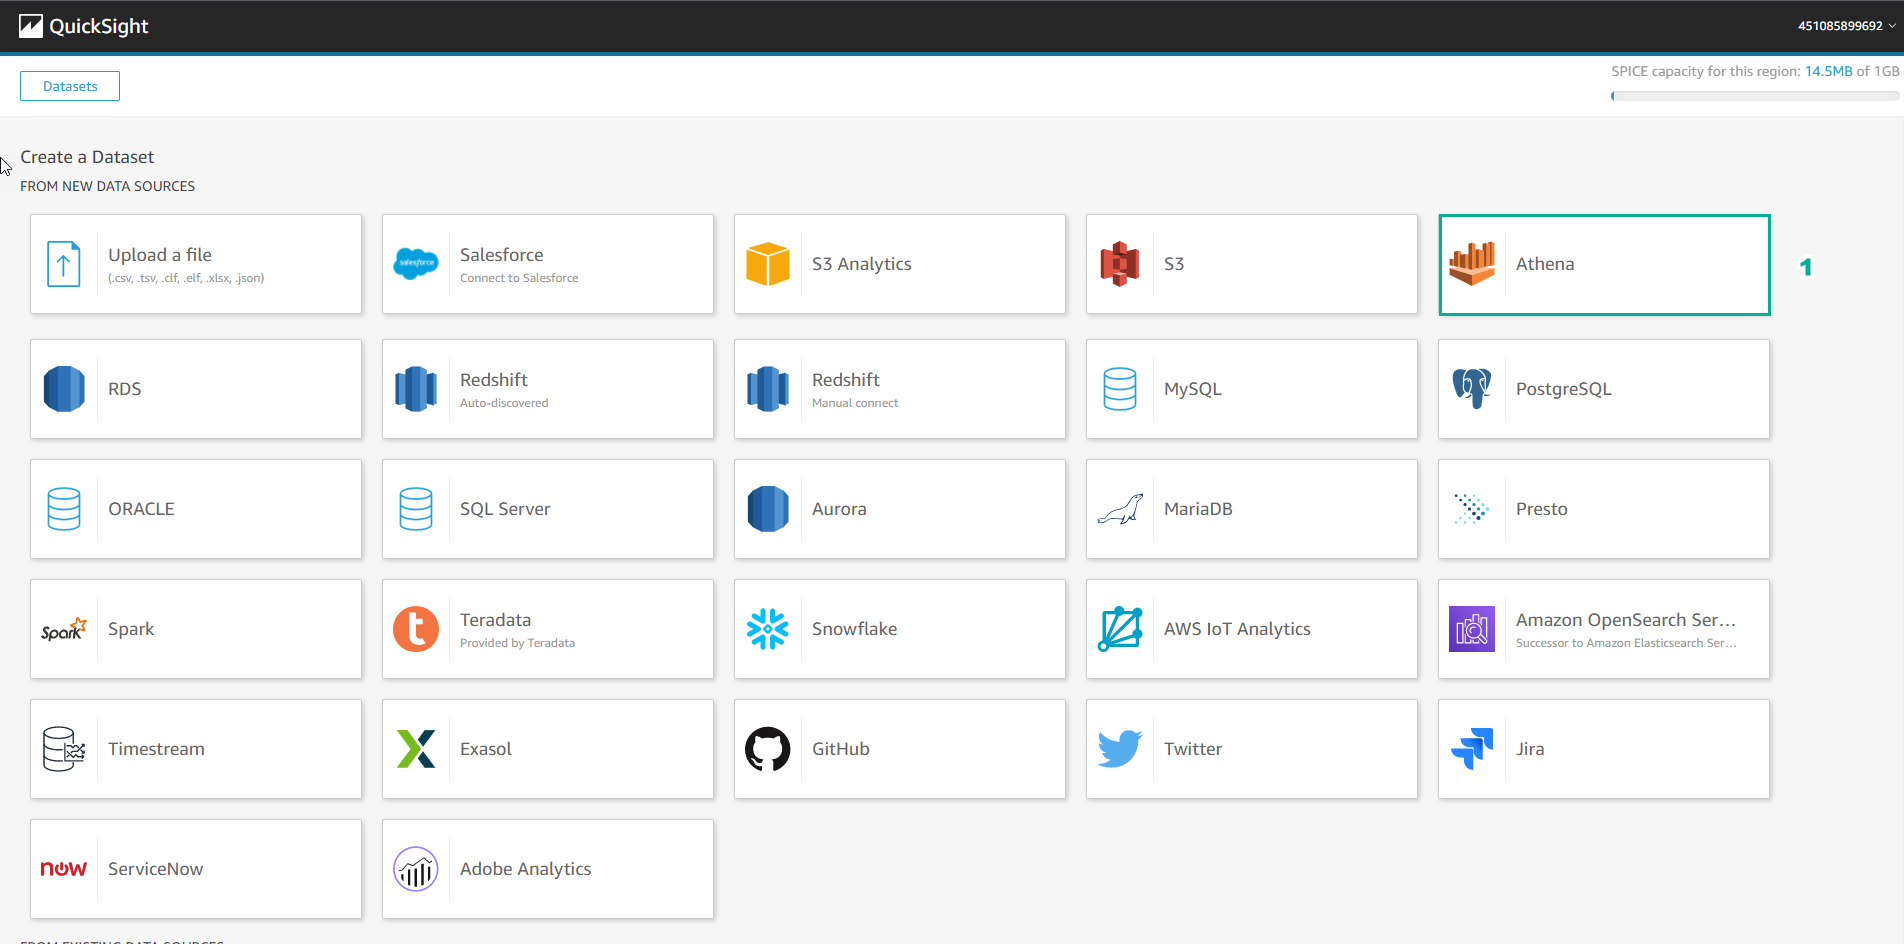
In the Create dataset interface:
- Choose the source from Athena
-
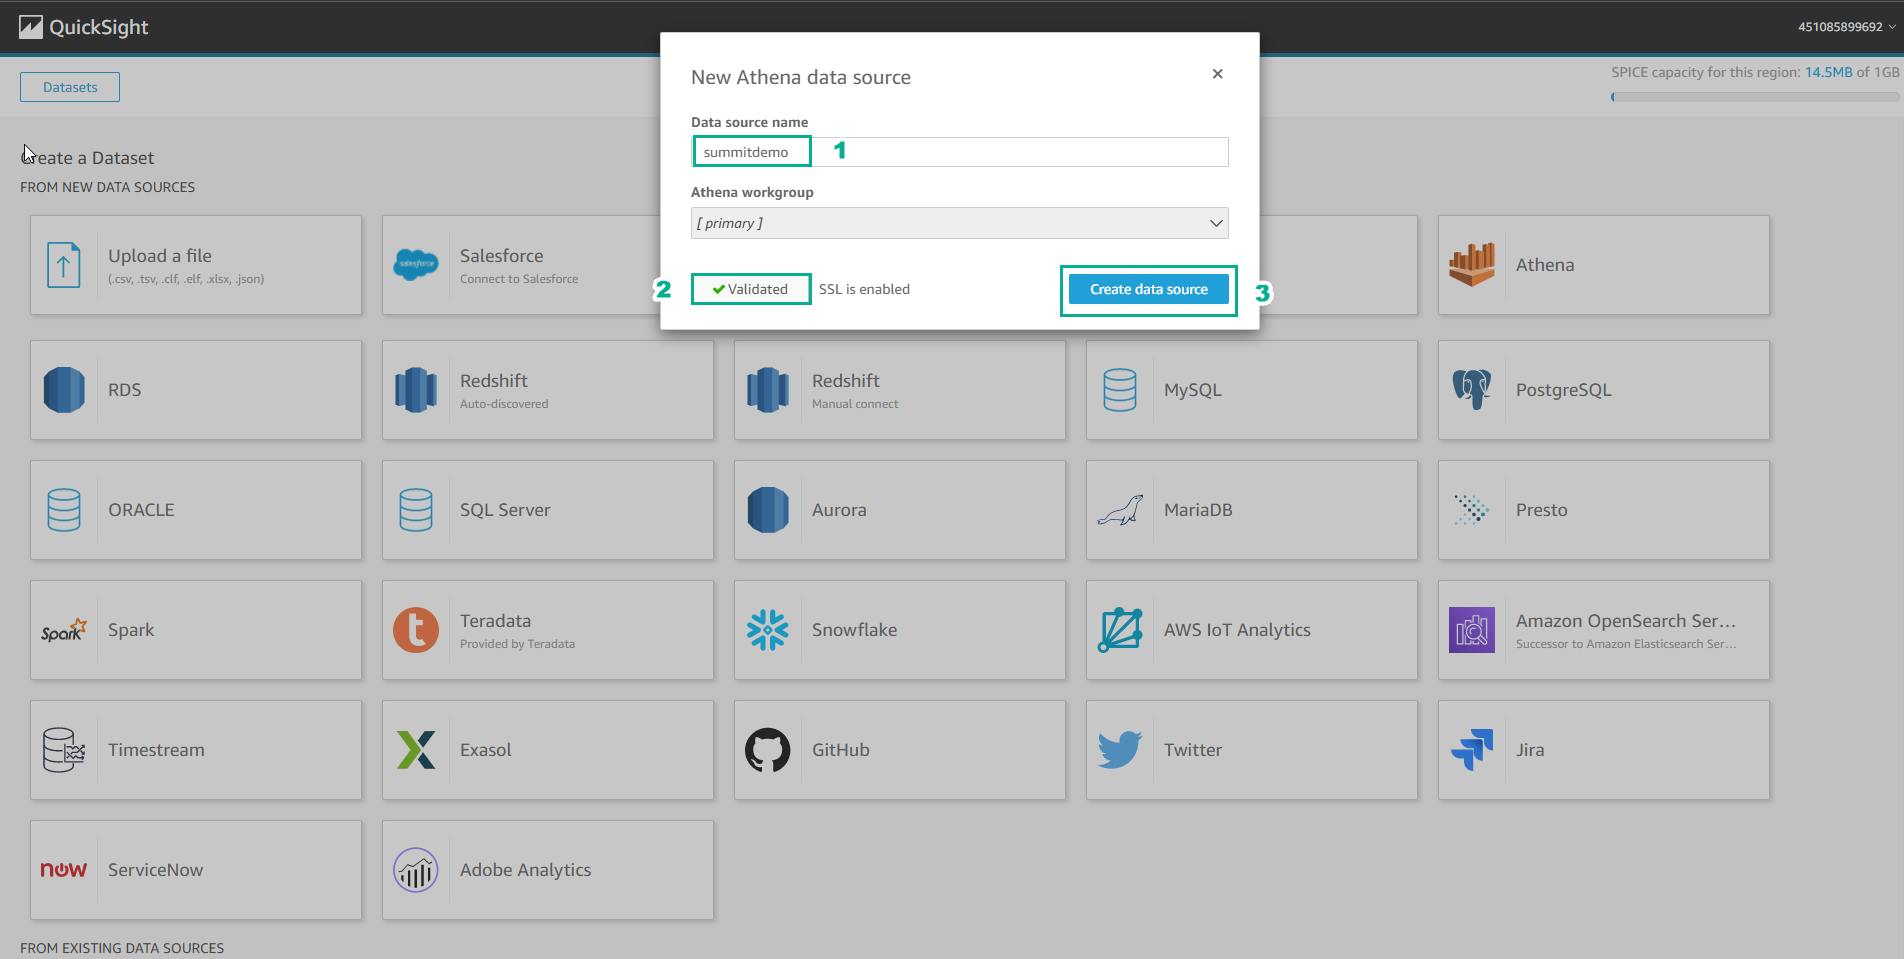
Configure the data source:
- Data source name, enter
summitdemo - Choose Validate Connection. If the connection is successful, it will display SSL is enabled
- Select Create data source
- Data source name, enter
-
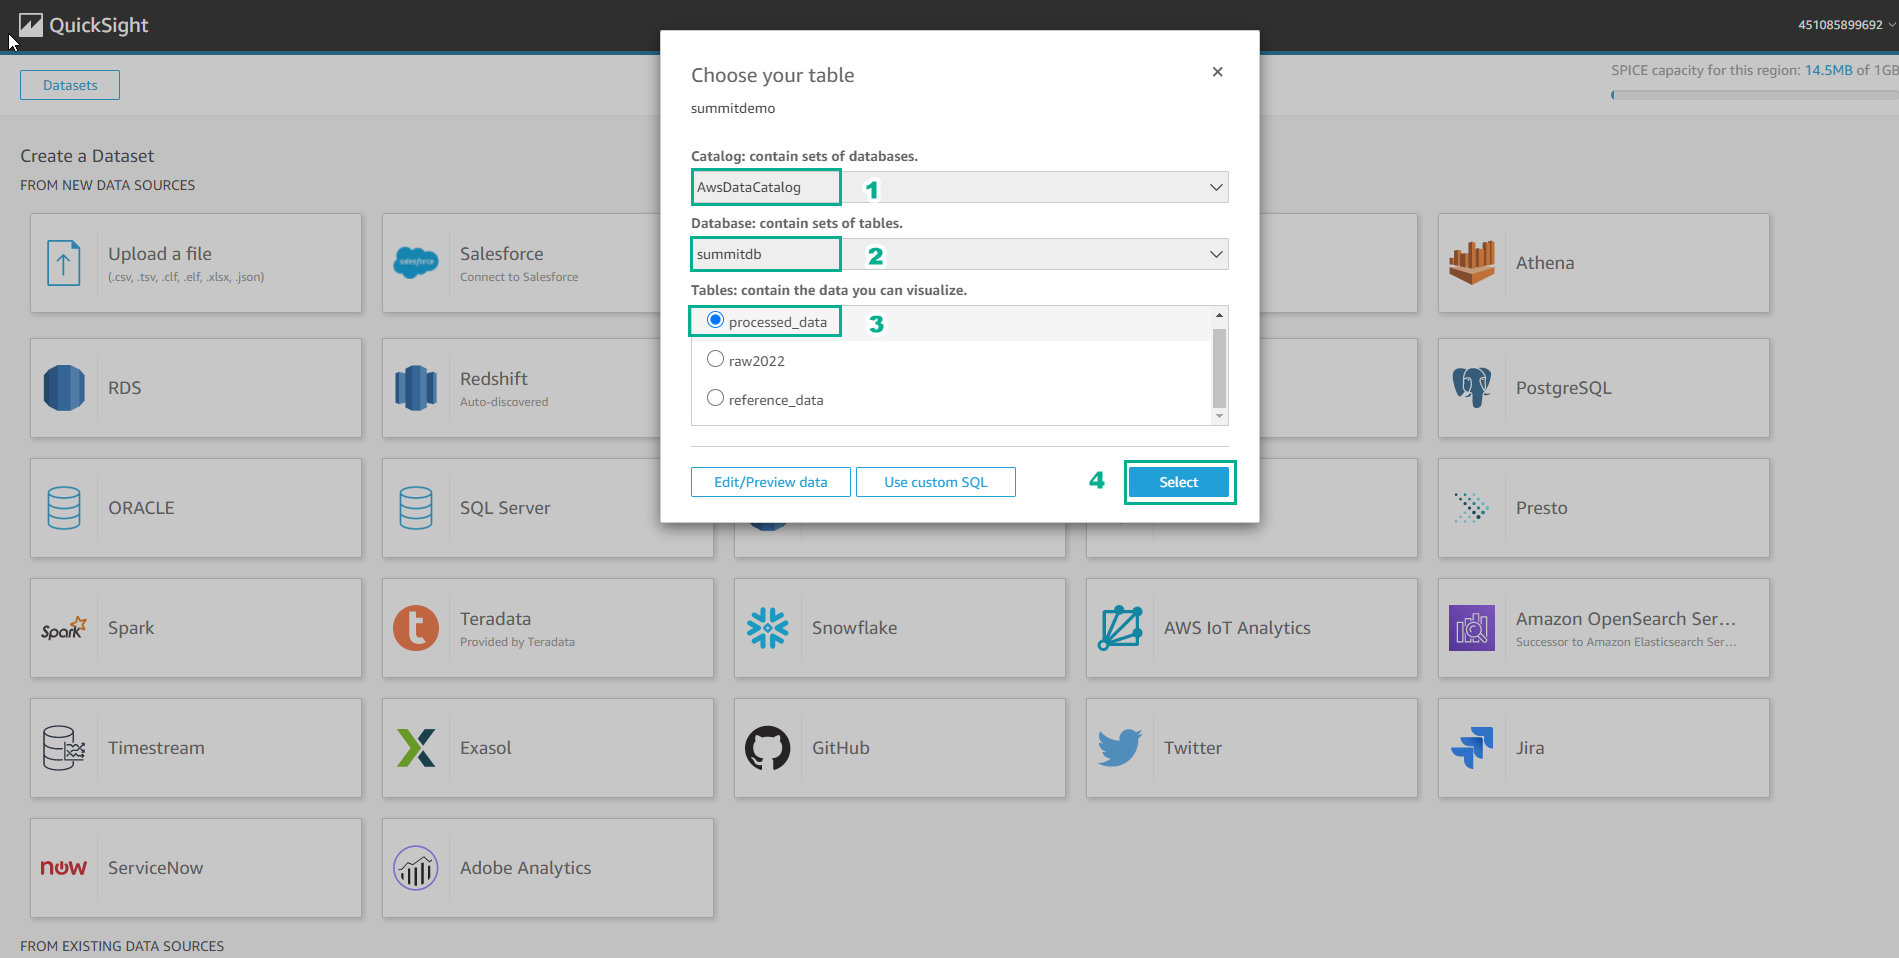
Choose a Table:
- Catalog, select AWSDataCatalog
- Database, enter
summitdb - Table, select processed_data
- Select Select
-
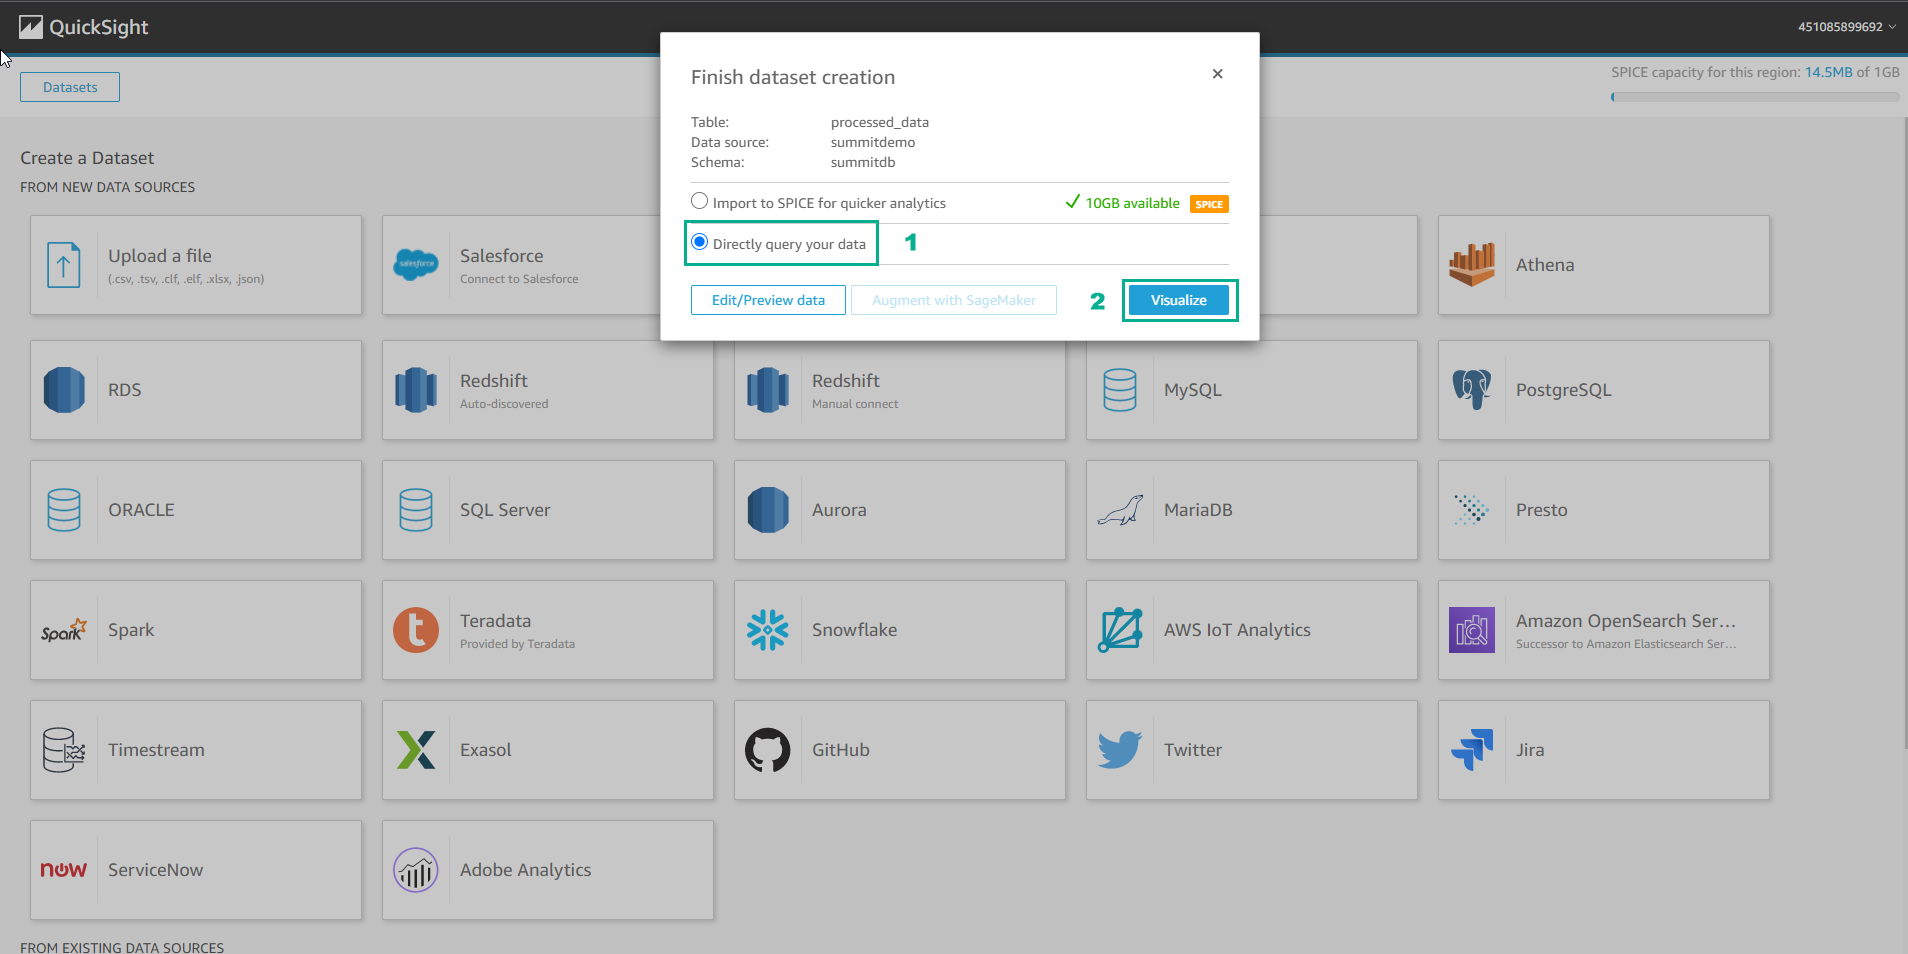
In the Finish dataset creation step:
- Select Directly query your data
- Select Visualize
-
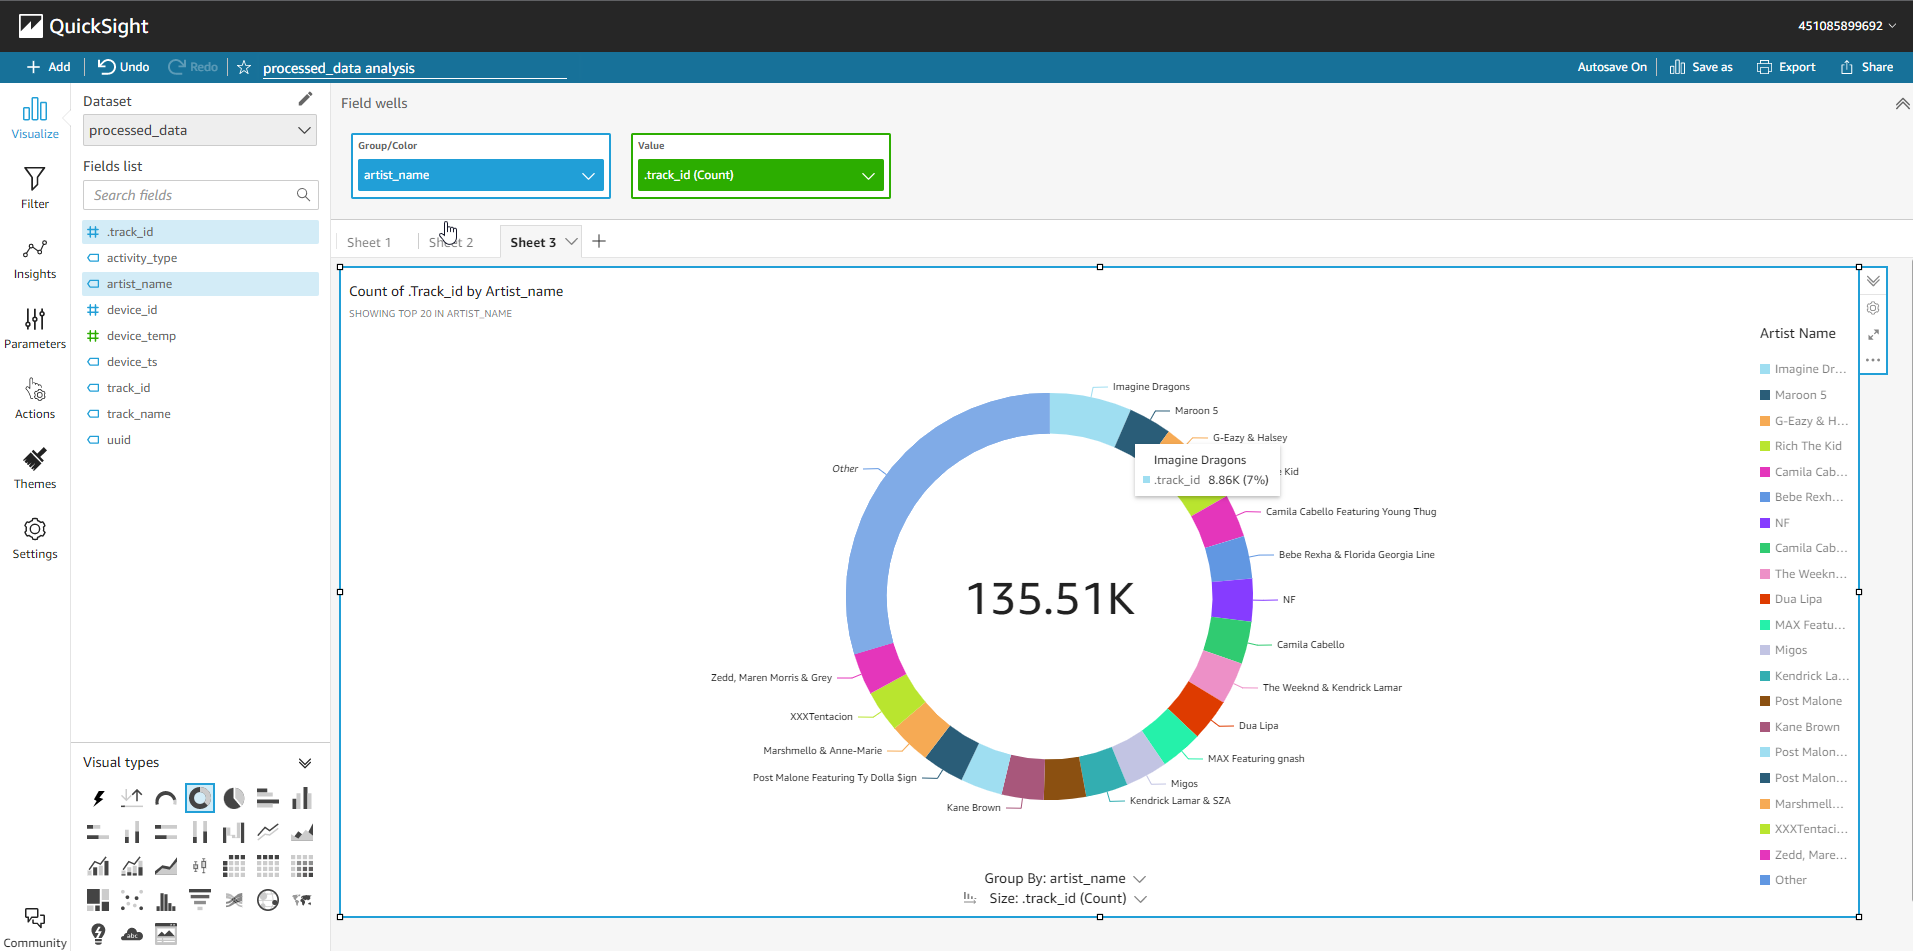
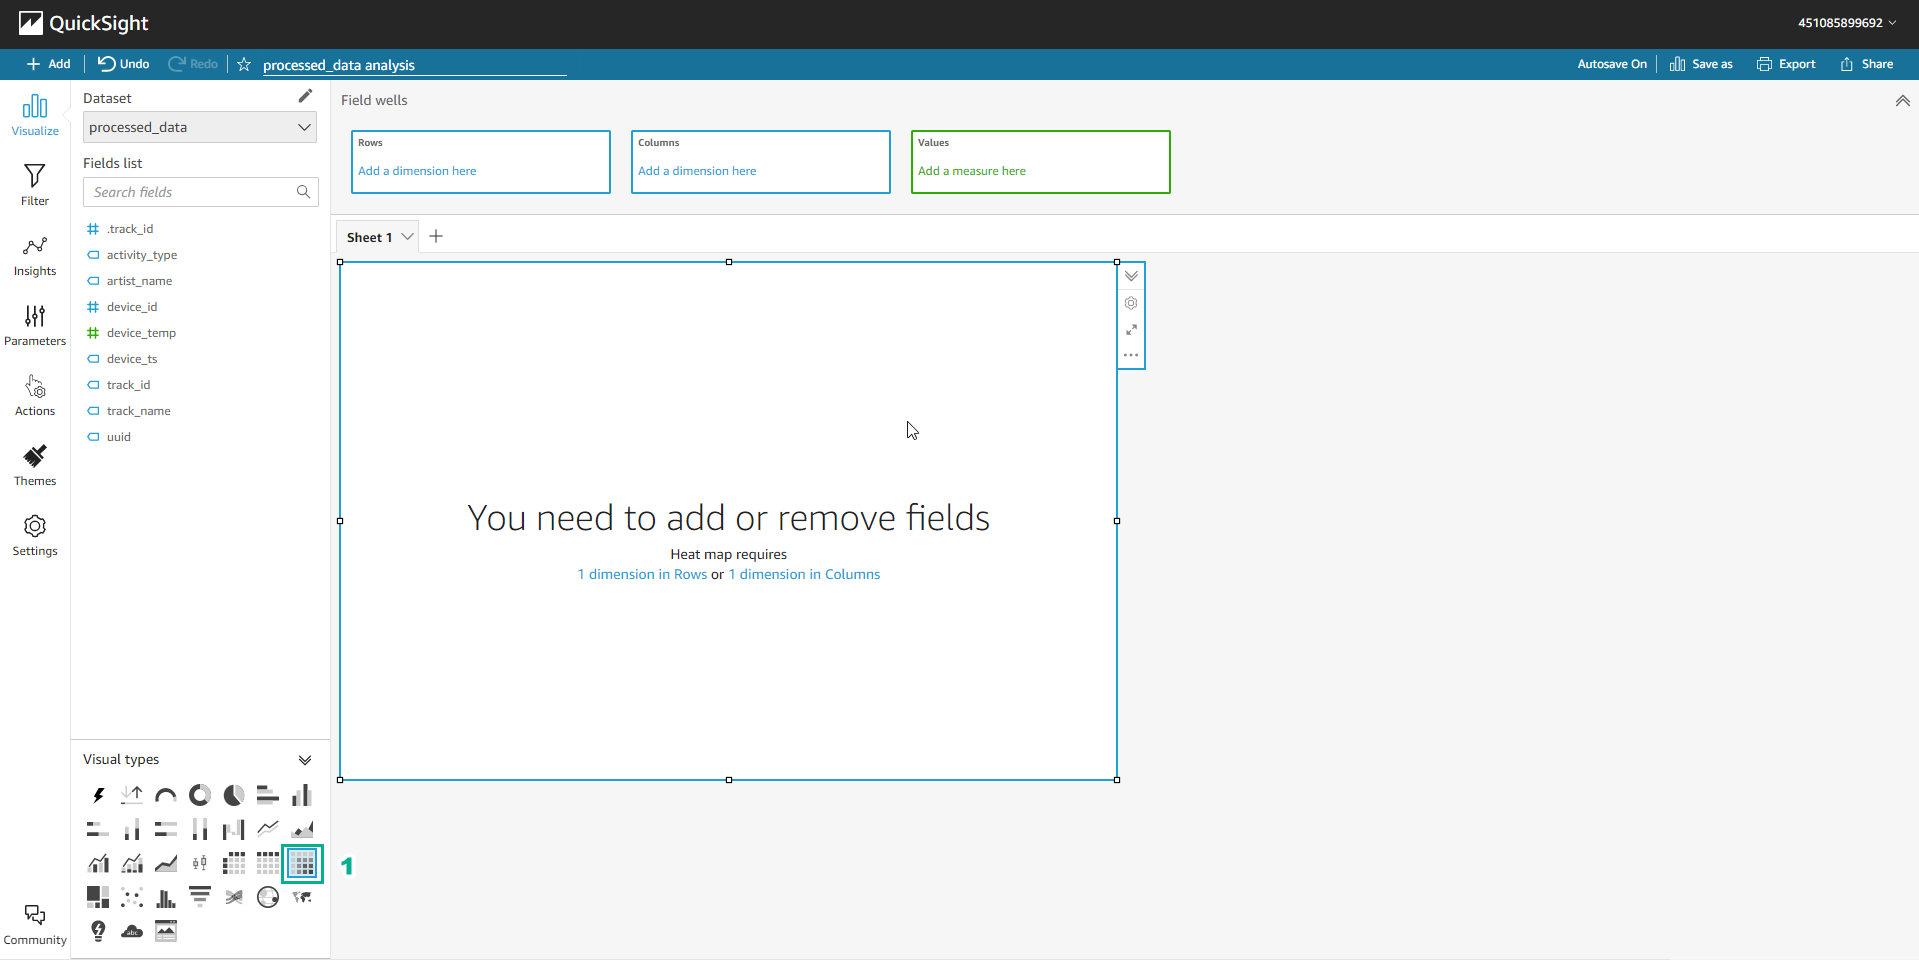
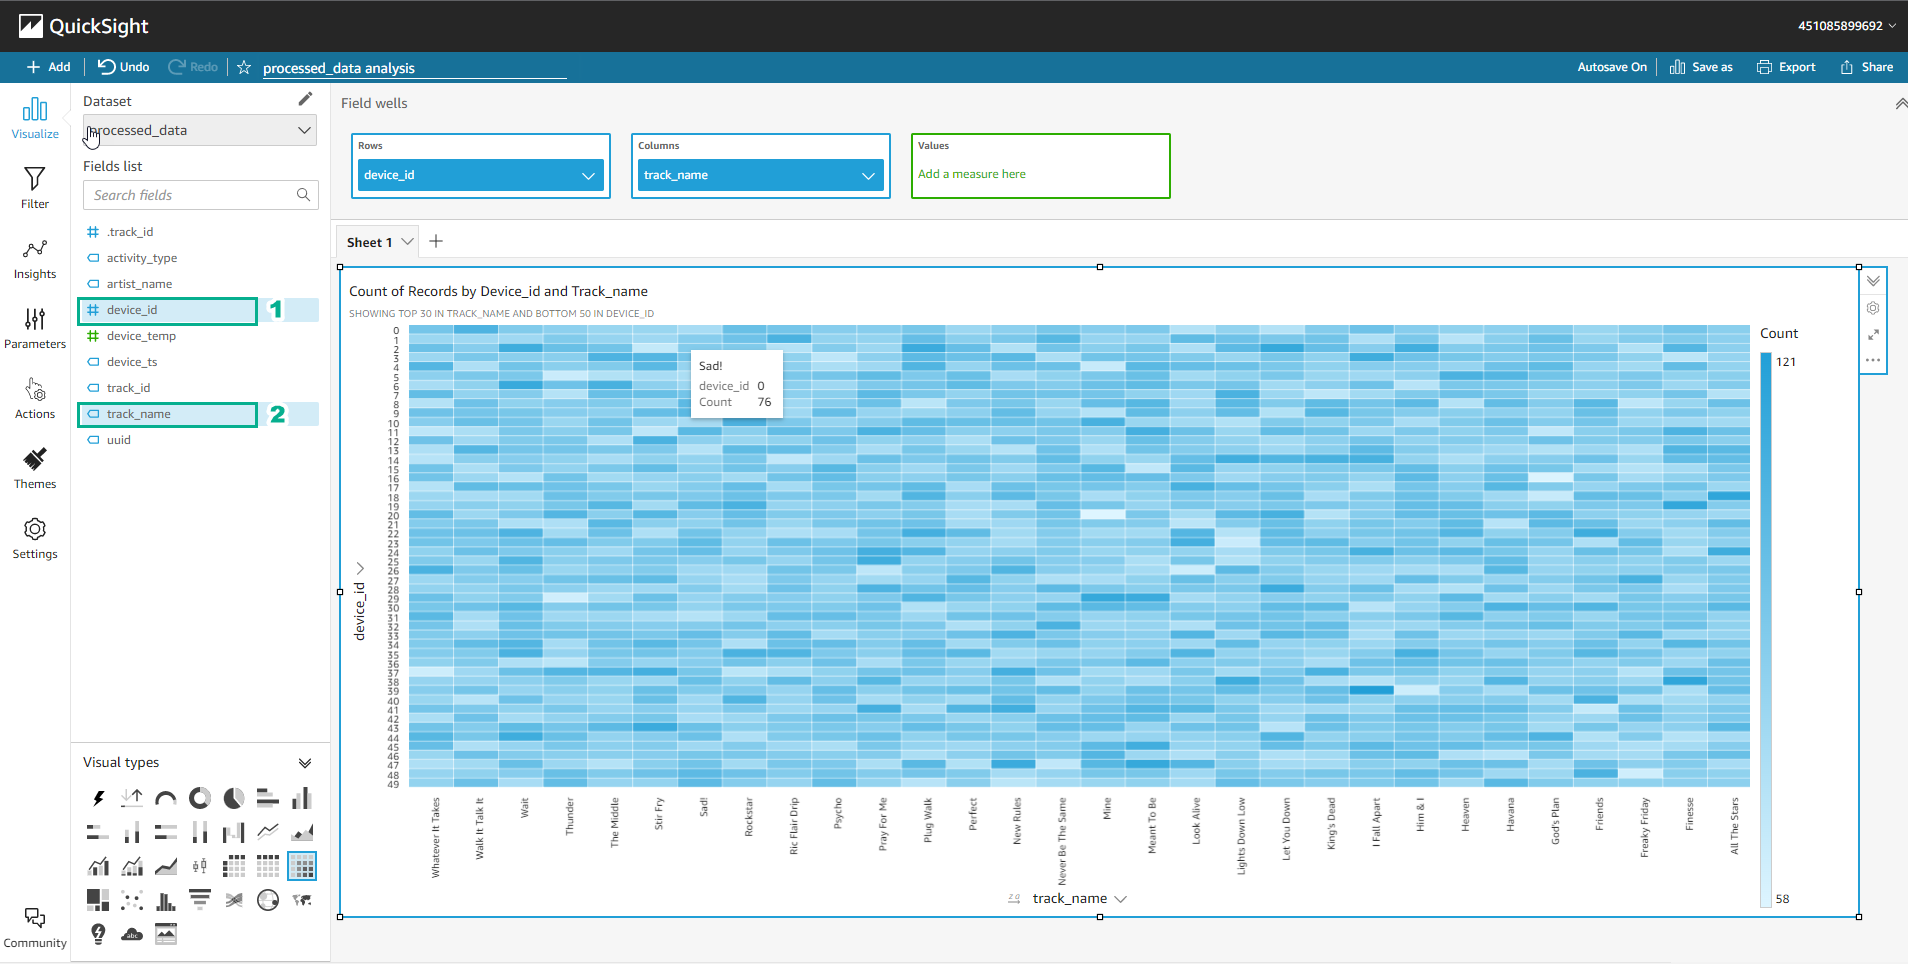
Use Amazon QuickSight to visualize the transformed data:
- Create a Heat map of users and the music tracks they listen to.
- In the lower-left panel - Visual types
- Hover over the icons to see the names of various visualizations
- Click on Heat Map
-
In the upper-left panel, in the Fields list:
- Select device_id
- Select track_name
- Right above the visualization, you will see Field wells: Rows - device_id and Columns - track_name (Make sure your Field wells are displayed correctly).
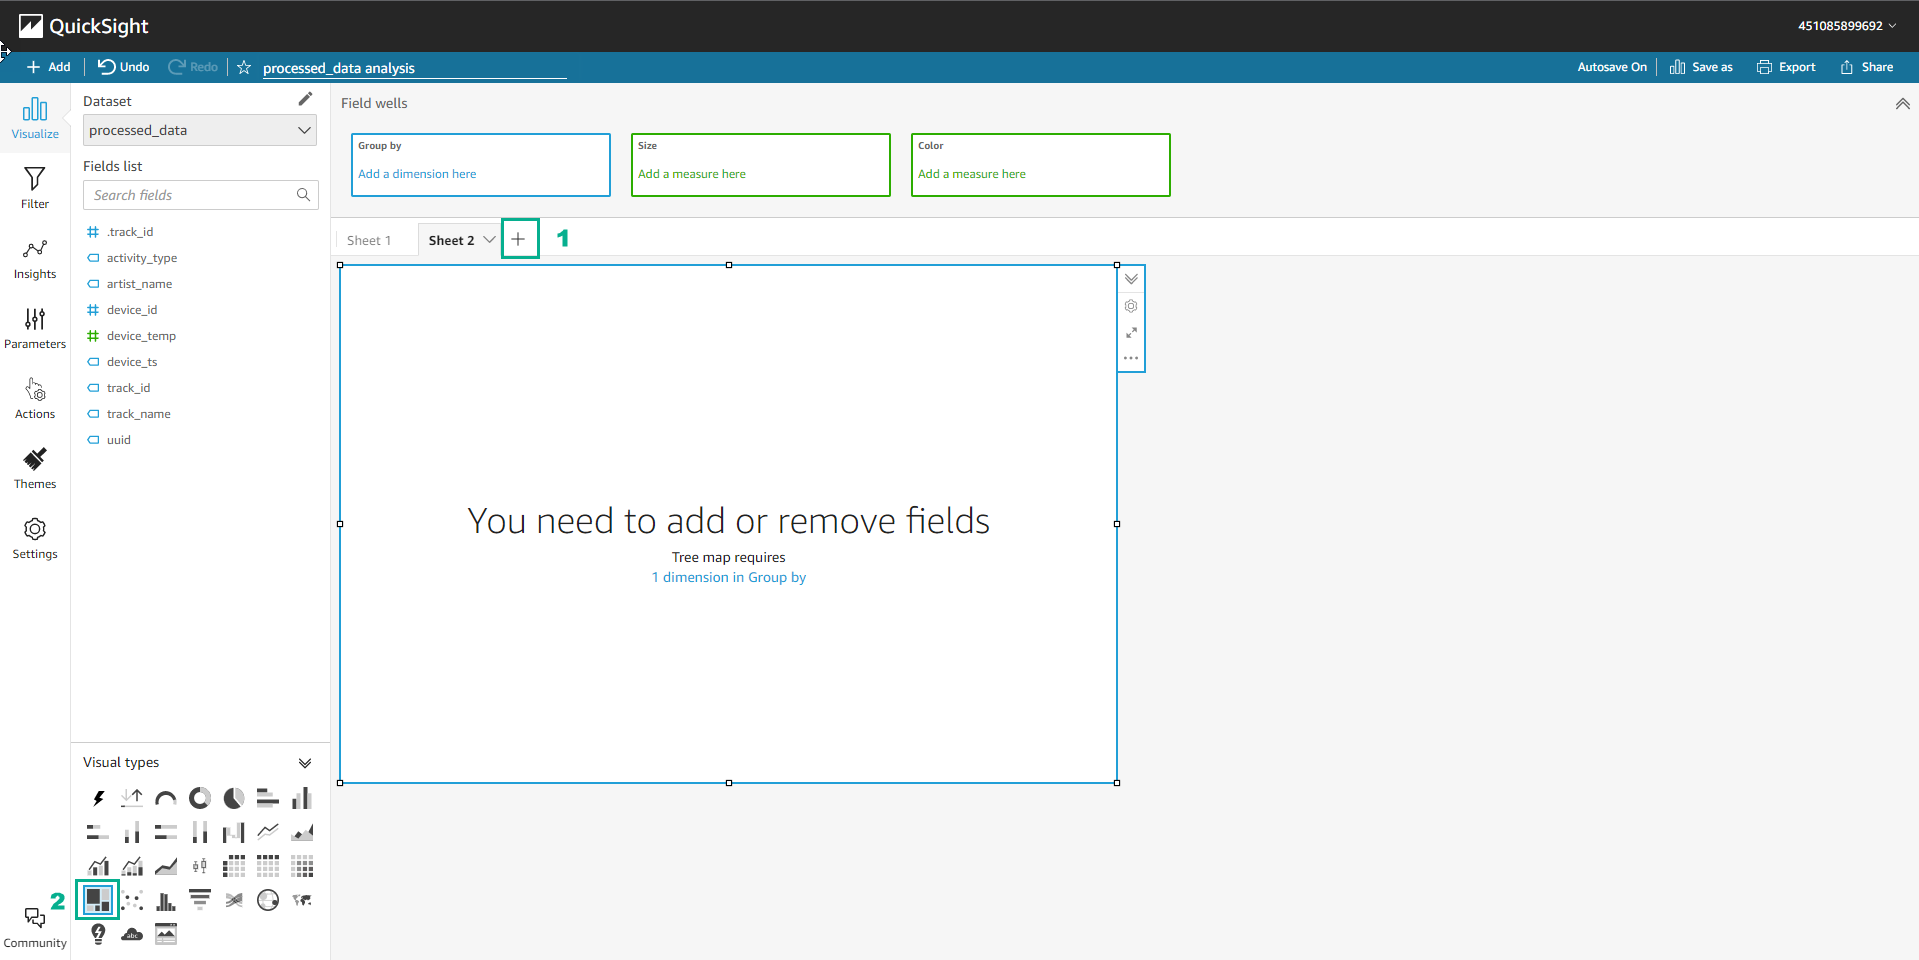
-
Create a Tree map showing the most-listened-to artists:
- In this step, we will create another visualization to show which artist is the most popular.
- In the lower-left panel - Visual types
- Hover over the icons to see the names of various visualizations
- Select Tree Map
-
Use similar steps for other Visual types.